Better context for every decision
Nexra Trader brings research, scanning and risk tools into the same workspace as your charts — so you can see what changed in the market, and why, before you place an order.
Not a crystal ball — a clearer view of the market
Plenty of platforms bolt on a "signals" widget and call it research. Ours is built around people and practical tools: the Nexra research desk publishing daily trade ideas, a Market Scanner tracking technical setups, and an Economic Calendar that rates every release by expected impact.
Together they give you a readable picture — the setup, the key levels, the events that could move price and the risk on the table. What you do with it stays your decision.
- Market Insights from our analysts every trading day across 250+ instruments
- Scanner and Sentiment Indicator updated live as market conditions change
- Every trade idea states its rationale, key levels and invalidation price
- Full archive kept, so you can review past ideas and how they played out
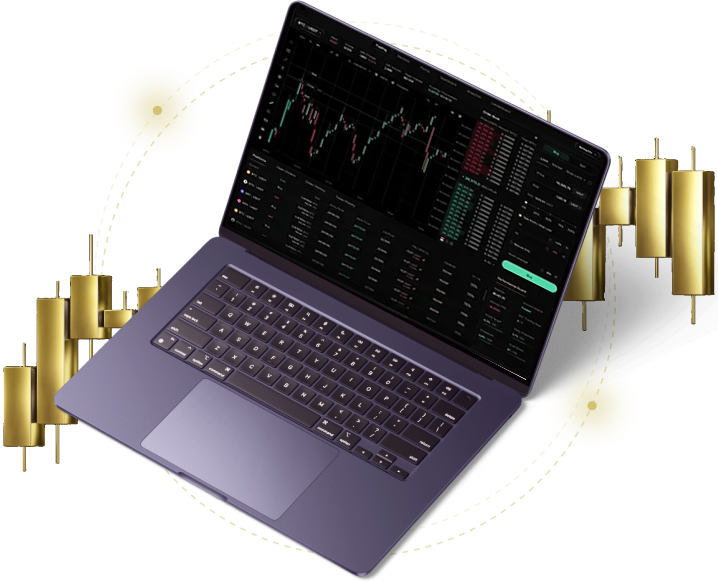
Six tools that ship with every account
Market Insights
Daily trade ideas and technical analysis from the Nexra research desk, each with context, key levels and a setup grade.
Market Scanner
Filters instruments by volatility, momentum, breakouts and trend, so you can find active markets and size down before the range expands.
Economic Calendar
Every scheduled release carries an impact rating, with forecasts, previous figures and the instruments most likely to react.
Correlation Monitor
Warns you when positions you think are independent have quietly become the same trade in three costumes.
Risk Calculator
Set your risk per trade and it sizes each position against live spread, stop distance and account equity.
Strategy Backtester
Run any rule set against ten years of tick data and see spread, slippage and swap included in the result.
From market data to a trade plan
Monitor
Live prices, the Economic Calendar and the Sentiment Indicator stream into your workspace in one view.
Research
The Market Scanner and daily Market Insights highlight setups worth a closer look on your charts.
Plan
The Risk Calculator and Correlation Monitor help you size the trade and check overall exposure.
Execute
Place the order in under 30 ms and let Smart Alerts notify you when price reaches your levels.
Know which events can move your trades
Every release on the Economic Calendar is rated by expected market impact — so you can filter to the events that matter for the instruments you hold and plan around them.
See it live| Impact | Typical events | What to expect | Typical frequency |
|---|---|---|---|
| Critical | Rate decisions, NFP | Sharp moves, wider spreads and possible gaps around the release | A few per month |
| High | CPI, GDP, PMIs | Clear volatility spike in the affected currencies and indices | Several per week |
| Medium | Retail sales, trade balance | Noticeable reaction, usually short-lived | Daily |
| Low | Minor surveys, auctions | Limited effect — informational context only | Continuous |
| Unscheduled | Breaking headlines | Unpredictable; consider reducing exposure or standing aside | Around news |
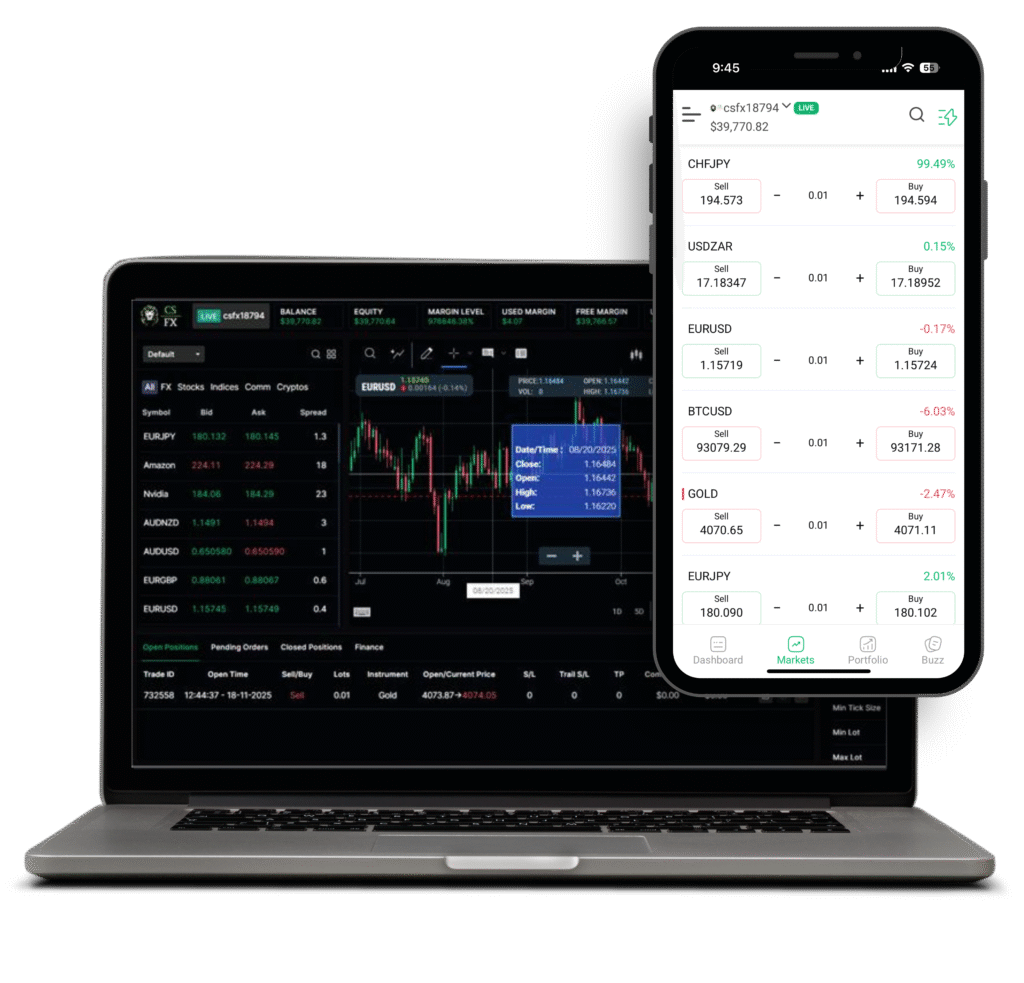
Bring your own algorithm
If you would rather trade systematically, Nexra Trader gets out of the way. Connect your own strategy through our API, or build rules inside the platform with no code at all.
REST and WebSocket API
Quotes, orders and account state, on Nexra VIP accounts.
No-code rule builder
Chain conditions visually and deploy in one click.
Realistic backtests
Spread, slippage and swap costs are all included.
Hard kill switch
Daily loss limits that halt automation automatically.